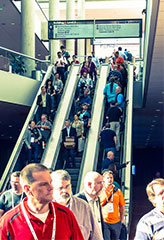
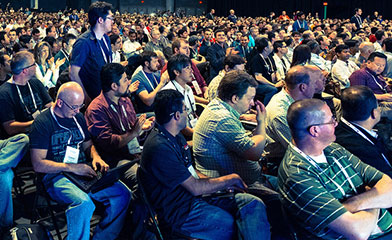
Here are some more videos from the Open Compute event at Facebook…
Facebook’s Open Compute Launch, April 7th, 2011 from OpenStack on Vimeo.
Facebook’s Open Compute Launch, April 7th, 2011 from OpenStack on Vimeo.

Here are some more videos from the Open Compute event at Facebook…
Facebook’s Open Compute Launch, April 7th, 2011 from OpenStack on Vimeo.
Facebook’s Open Compute Launch, April 7th, 2011 from OpenStack on Vimeo.
Many people have asked for more insight into the developer activities for OpenStack as the large number of code changes and proposals make it difficult to monitor everything happening. In hopes of exposing more of the developer activities, I plan to post a weekly or biweekly blog post on the latest development activities. If you have any ideas for this blog post, please email me at [email protected]. I am always ready to listen to the community for new ideas.
Activities
Developer Mailing List (archive: https://lists.launchpad.net/openstack/)
This is select list of topics discussed this week in the developer mailing list and is not a complete list. Please visit the archive to see all the topics.
Statistics
For the latest on development activities on OpenStack please check these sites for more details:
OpenStack Community Newsletter – April 15, 2011
This weekly newsletter is a way for the community to learn about all the various activities occurring on a weekly basis. If you would like to add content to a weekly update or have an idea about this newsletter, please email [email protected].

Todd Willey – On Break from Documenting OpenStack
HIGHLIGHTS
EVENTS
DEVELOPER COMMUNITY
GENERAL COMMUNITY
COMMUNITY STATISTICS (4/8– 4/15)
OPENSTACK IN THE NEWS
With the availability of the Cactus release of OpenStack today the momentum and progress of the project continues to grow. A tremendous amount of effort and contribution from the large, and growing, community has added significant features, fixed a lot of bugs, and debated and discussed many technical issues. I am impressed with the progress that has been made since the Bexar release just 10 weeks ago and believe the projects and code are tracking to fill the promise of being the ubiquitous, open source cloud solution.
New features in Nova (OpenStack Compute) include:
New features in Glance (OpenStack Image Registry and Delivery) include:
New features in Swift (OpenStack Object Storage) include:
In addition to the work done on the project code, there have been several other things happening to improve the state of OpenStack. Primary amongst these was the election of Project Team Leaders for the three current OpenStack projects… Congratulations to Vish Ishaya (vishy) [Nova], John Dickinson (notmyname) [Swift], and Jay Pipes (jaypipes) [Glance] as new PTL’s, they also join the OpenStack Project Policy Board.
The OpenStack Project Policy Board also had elections, with 5 board members holding elected seats. These are Thierry Carrez (ttx), Rick Clark (dendrobates), Eric Day (eday), Soren Hansen (soren), and Ewan Mellor (ewanmellor). Congratulations folks!
OpenStack has defined a process for bringing in new projects, both as core projects and those that are being incubated. (See http://wiki.openstack.org/Governance/Approved/NewProjectProcess). The initial incubation project is “Burrow”, a simple queuing service for OpenStack being led by Eric Day (eday). At the upcoming Diablo Design Summit I expect several more projects to be proposed for incubation; including Load Balancing and Database Services.
The Diablo Design Summit is setting up to be the most dynamic and content-filled summit to date! The entire week is completely filled with attendees and items for discussion. While ttx and the PTL’s are busy scheduling all the sessions here are a few of the highlights:
A job well done to all of the folks that contributed and made the Cactus release come together and get released. I will see all of you at the Design Summit in Santa Clara and look forward to the discussions around the Diablo release and the future of OpenStack!
Lastly, the OpenStack Project Team Leaders are hosting a Webinar on Tuesday April 19th at 3:00 pm CST. More information at http://www.openstack.org/blog/2011/04/openstack-cactus-webinar/.
John
Director, OpenStack@Rackspace
In less than two weeks now, the community around OpenStack will gather in Santa Clara for two co-hosted events: the OpenStack conference and the Diablo Design Summit. In this post I’ll explain what attendees should expect from both, and give some precisions on how the Design Summit will be run.
The OpenStack conference will run on two days, from Tuesday April 26 to Wednesday April 27. This is a classic conference, with speakers making presentations on various OpenStack-related topics. We’ll have keynote sessions on Tuesday morning, then parallel technical and community tracks will run during Tuesday afternoon. The day will end with a reception sponsored by Cisco. On the Wednesday, the “User track” will run during the morning and the “Service provider” track will run on the afternoon.
The Diablo Design Summit will run on three days, starting Wednesday morning to end on Friday evening. It’s a gathering of OpenStack developers to discuss how the next releases of OpenStack should be made and brainstorm the design of the key features we’ll add. Developers submit blueprints, those are turned into session topics and scheduled in the available session slots.
Since developers are currently busy getting the “Cactus” release out, we expect the schedule to start to take shape during next week. You should expect sessions on release management to occur on the Wednesday morning, and once the expectations are set, various sessions on Nova, Swift, Glance and other OpenStack projects spread throughout the 3 days of the event. Sessions will be categorized so that it’s easy to tell what the topic is by looking at the schedule.
The sessions are held in fishbowl-style room layout, with a session lead (usually the submitter of the blueprint) moderating the discussion. You can look up the whole process in more details at http://wiki.openstack.org/Summit
During the three days, after lunch, we’ll also have Lightning talks to let attendees have a forum to quickly talk about their crazy idea, present their product or do a quick demo. Every subject is OK as long as it’s OpenStack-related ! Those will be openly-scheduled on a whiteboard, everyone is free to book available 5min slots.
On the social side, Wednesday evening there will be an OpenStack Developer Gathering in the developer lounge, sponsored by Niciria. On the Thursday evening we’ll have our traditional Developer party, sponsored by Cloudscaling.
I hope this clarifies what the events are all about, and I’m excited to see you all in less than two weeks now !
Good news to all you community manager types still in college looking for real-world, hands-on experience, I am looking for a summer intern to assist me in various aspects of the open source OpenStack community. The position is in Austin, TX and I don’t have funding for housing so the candidate must either live in Austin or be capable of supporting themselves; however there is a salary involved but it most likely will not cover your living expenses in Austin this summer.
Here is the information on the position:
Job Description:
This position will support the various day-to-day activities of managing a large, global open source community. An emphasis on social network data collection and analysis is an integral part of the position while also supporting the various other community activities including web content development, community member communication, event planning, and other tasks.
It is expected that a presentation will be presented to various community members at the end of the summer to educate the community on the social networking aspects of OpenStack and how the community can better leverage those tools.
Job Requirements:
Applicants for this position must have the following skills:
If you are interested in this position, please send your resume to [email protected] by April 30, 2011.

As many of the participating companies in the OpenStack ecosystem are startups, it is great to see important milestones reached. As of today, Midokura, a pioneer in the network virtualization space providing cloud-enabling technologies for both public and private clouds, has announced the raising of 1.3 million USD in seed-funding. The complete announcement is at http://www.midokura.com/pr/pr04132011.html. Congratulations to Midokura and we look forward to a successful relationship with the OpenStack community.
UPDATE: This webinar has been rescheduled to Thursday April 21st at 4pm EST. Please register at https://cc.readytalk.com/r/kdi85356wy
As part of a new community project, the OpenStack Webinar Series, I am pleased to announce the OpenStack Cactus Webinar for April 19th from 3:00 – 4:00 pm CST. This Webinar will cover the new features implemented in the OpenStack Cactus release. Presenting these features will be the new Project Team Leads for Glance, Swift, and Nova.
To join the webinar, simply click http://connect33143669.adobeconnect.com/cactus/.
As OpenStack is a truly global community, I will record this event and make it publicly available as there is no best time to hold a global Webinar.
Finally, this Webinar is the first in a series of twice a month Webinars on various OpenStack topics. If you are interested in presenting a topic, please contact [email protected] for scheduling information.
Here are some videos of the event last week at Facebook.
Mark Zuckerberg introduces Open Compute April 7th, 2011 from OpenStack on Vimeo.
Nati Shalom from GigaSpaces posted a blog today, “GigaSpaces OpenStack Explained.”
From the post,
One of the major concerns of many IT organizations is cloud vendor lock-in. This concern was expressed recently in “Banks fear cloud vendor lock-in ,” from IT Wire:
The onset of cloud computing gives vendors the chance to lock customers in to their infrastructure, using proprietary protocols to ensure they’re on the monthly billing cycle as long as possible.
The OpenStack project emerged with a mission to address this concern by creating a community-led open source project enabling any organization to create and offer cloud computing services running on standard hardware.
GigaSpaces joined the OpenStack project with the mission to enable any organization to build its own Platform-as-a-Service (PaaS), with its own choice of language and best-of-breed middleware stack.
In this post, I’ll try to provide more insight into our current and future plans around OpenStack, and more specifically our joint collaboration with the Citrix OpenCloud initiative.